|
|
|
|
|
|
| April 25, 2024 |
|
What new census says about Southern California 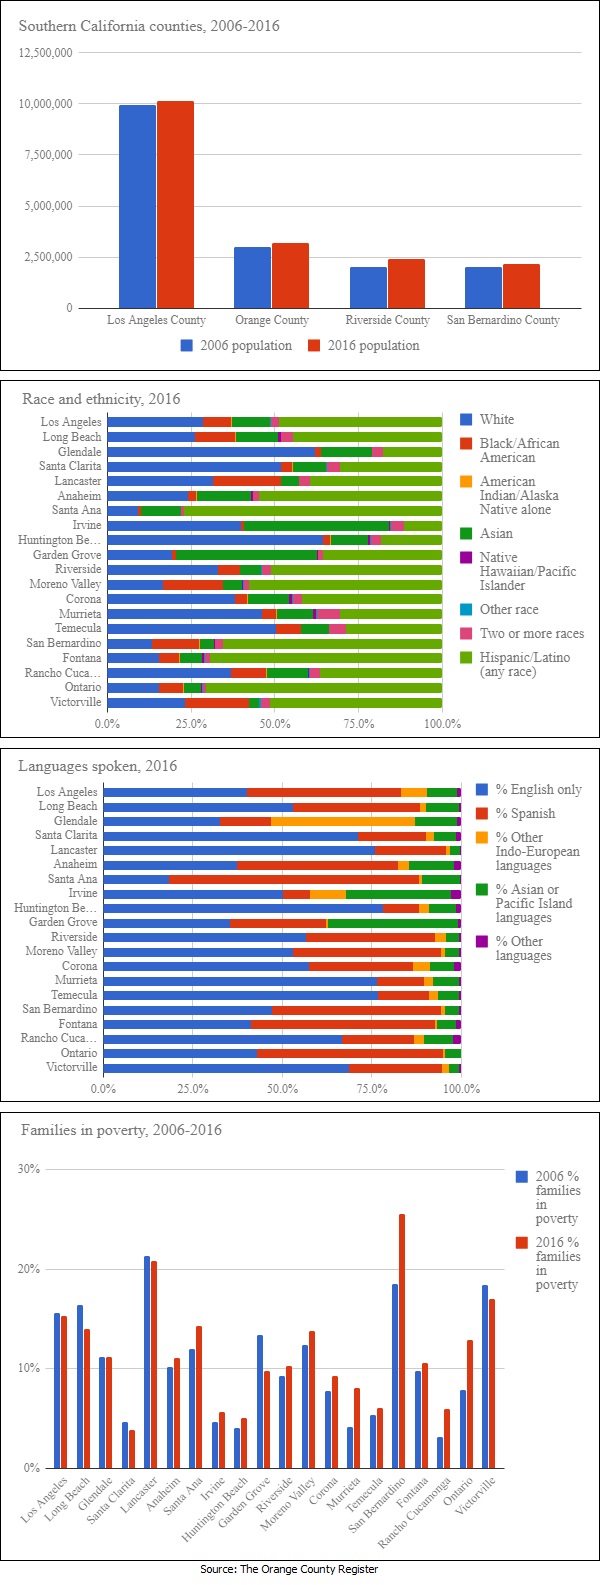
Big cities got bigger and a couple mid-sized cities exploded.
Immigration didnt change as much as you might think. And while property values havent fully recovered, post-recession, the cost of renting a home or apartment has surged, adding to conditions that have resulted in broad jumps in homelessness. Those are some of the ways in which Southern California has changed over the past decade, according to Census Bureau estimates released to the public today. Though the census numbers show some state-to-state comparisons (California is the most impoverished state in the union when factoring housing into the mix), the Southern California News Group used the data to look at the five biggest cities in Los Angeles, Orange, Riverside and San Bernardino counties. The numbers were snapshots from 2006 and 2016, offering a statistical glimpse of the region before and after the recession of 2007 and 08 and the long, slow recovery that followed. The data tells stories about population, poverty rates, education levels and migration patterns, among other things. The easiest number to digest is about people. Southern California counties population, 2006-2016 Los Angeles is still biggest kid on the block in Southern California, with nearly 4 million residents. But it grew only about 5 percent over the decade, even as other communities grew at much faster clips. Irvine, the city with the beige reputation and a strong international flair, saw its population increase 46 percent to about 266,000, the biggest jump of the 20 cities tracked. The budding wine burg of Temecula was close behind, growing 43 percent to about 112,000. Big population increases also were seen in Murrieta (23 percent), Victorville (21 percent) and Fontana (19 percent). Cities that grew slowly included Long Beach, just 1 percent, while Santa Ana was the only city examined to see its population decline, by 5 percent, to about 334,000. Overall, population grew in all four counties. Riverside was up 18 percent; San Bernardino 7 percent, Orange 6 percent, and Los Angeles 2 percent. Race and ethnicity, 2016 While population, overall, grew in Southern California, the makeup of that population, at least based on race, ethnicity and country of origin, shifted at different rates in different communities. One trend common in the region since 2006 is that the share of non-Latino white people is declining. That racial group shrunk as a share of the population in 19 of the 20 cities surveyed, and in the one city where it didnt drop (Fontana) it stayed the same, at 15.4 percent. Based on 2016 data, non-Latino white people are no longer the majority in both Murrietta and Irvine. At the same time, Latinos, who can be of any race, became the majorities in Victorville, Riverside, Moreno Valley and Anaheim. In 2016, Latinos dominated Santa Ana, making up 77 percent of residents. Other cities with large clusters of one group or another include Huntington Beach (64 percent non-Latino white), Lancaster (20 percent Black or African American) and Irvine (43 percent Asian). Language spoken, 2016 Language also is shifting, with English losing ground. Within the past decade, Ontario became the regions third Spanish-language majority city of those surveyed, joining Santa Ana and Fontana, where Spanish was already the majority language in 2006. In Garden Grove a city with a large Vietnamese-American community, 36 percent of residents speak an Asian or Pacific Islander language. And in Glendale, where there is a strong Armenian community, 40 percent of the residents speak an Indo-European language; residents are more likely to speak an Indo-European language than they are to speak only English. Birthplace, 2016 Overall, the growth of languages other than English isnt reflected in changes in the population. After decades as a Mecca for foreign-born transplants, the percentage of foreign-born residents fell in 15 of the 20 Southern California cities examined. Los Angeles saw a 2 point dip in the number of foreign-born residents from 2006 to 2016, and there were similar trends in the other counties largest cities, Anaheim, Riverside and San Bernardino. But those numbers might reflect saturation; a lot of people born outside the United States already have moved to the region. Glendale has the largest share of foreign-born residents, 53 percent, followed by Santa Ana (46 percent) and Garden Grove (44 percent). Temecula has the fewest foreign-born residents, at 15 percent. Families in poverty, 2006-2016 More Southern California families lived in poverty in 2016 than in 2006, according to the 20-city data and it wasnt simply a function of growth. Overall, the number of families in the 20 cities increased by 7.8 percent over the decade, while the number of families at or below the poverty line rose by 9.1 percent. Garden Grove, Long Beach and Santa Clarita were fortunate outliers, seeing fewer families in poverty even as they saw population rise: - In Garden Grove, the number of poor families plunged 24 percent (4,865 to 3,688). - It was down in Long Beach by 15 percent (16,085 to 13,663). - In Santa Clarita, it was down 2 percent (1,773 to 1,738). Others were not so fortunate. The most stunning increases in poverty came in cities experiencing great population growth but it was also a function of mathematics, as some of their populations were small to start. Murrieta saw the number of families in poverty rise by 123 percent from 957 to 2,132. Meanwhile, the number of people living in poverty: - Rose 120 percent in Rancho Cucamonga (1,160 to 2,549). - Rose 86 percent in Irvine (1,989 to 3,705). - Rose 81 percent in Ontario (2,779 to 5,029). In the city of Los Angeles, the number of families in poverty was up 4 percent (121,684 to 126,429). In the 2006 census, the poverty threshold was $10,294 for an individual and $20,614 for a family of four. In 2016, it was $12,228 for an individual and $24,563 for a family of four. Annual household income, 2016 At the other end of the spectrum, Irvine claimed the largest share of well-off residents and theyve become more comfortable as the years passed. In 2006, 22 percent of Irvine families earned $150,000 or more a year. A decade later, 30 percent earned that much. And those at the top of the ladder earning more than $200,000 saw a great jump, from 11.7 percent to 18.4 percent. Santa Clarita was next-most-prosperous, with nearly 25 percent of its residents earning more than $150,000; followed by Huntington Beach (22.1 percent); Rancho Cucamonga (19.5 percent) and Temecula (19.4 percent). The city of San Bernardino had the smallest slice of top-rung earners just 4.6 percent making more than $150,000. It had, by far, the most families on the ladders bottom rung, with 61.9 percent earning less than $50,000 a year. Victorville and Lancaster each had 52 percent of residents earning less than $50,000 a year. That was a decrease for Lancaster, and an increase for Victorville, over 2006. Unemployment rate, 2006-2016 On the unemployment front, rates fell from 2006 to 2016 in Long Beach, Lancaster, Anaheim, Santa Ana, Huntington Beach and Corona. They grew in 13 other cities, led by Glendale (4.2 points), Victorville (3.4 points) and Irvine (3 points). Los Angeles held steady. The only city with a double digit unemployment in 2016 was Victorvillle, at 13 percent. (Source: The Orange County Register) Story Date: September 18, 2017
|
      |